


 [Photo: Jeffrey Camp] |
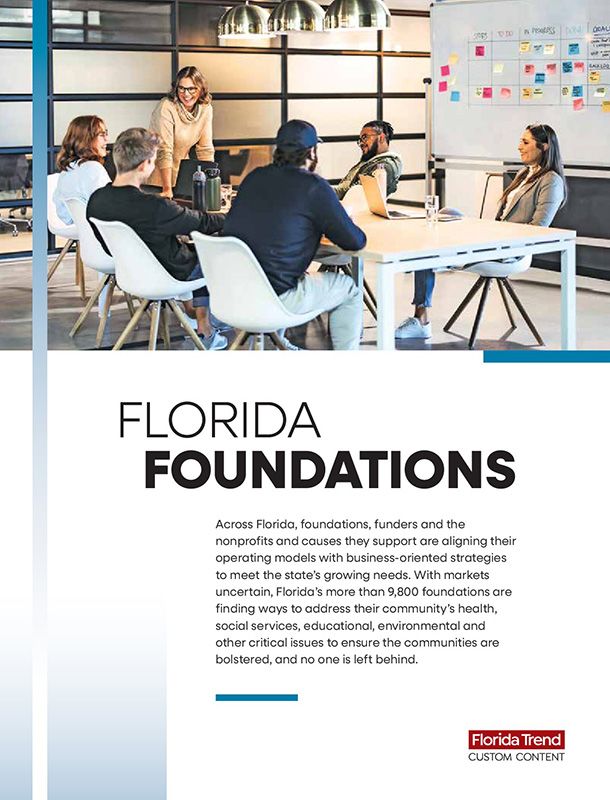
Demographically and historically, Ocala and Marion County are Old Florida — less urban, less diverse, less transient. Only 7% of the population is foreign-born. In 2008, 97% of residents had either lived in the same county a year earlier or moved from another county in Florida. The area’s public image is likewise pastoral, shaped largely by springs, forests and the billion-dollar equine industry. Despite recent inroads by suburban development, the county is still home to more than 70,000 acres of breeding and training farms for all manner of horses, from thoroughbred racers to polo ponies and American Quarter Horses.
Economically, however, Ocala and Marion are trying to play at a more modern tempo, blending the area’s traditional virtues with a more up-to-date business infrastructure. A key goal is a moderated role for the housing sector that has driven growth for several decades and sent subdivisions sprawling into horse country. Economic developers tout the proximity to major transportation arteries and lower costs of building, housing and labor. Three major state universities — USF, UCF and UF — are within about an hour and a half away. The local manufacturing sector, hit hard during the recession, is small but vibrant. Healthcare resources are solid. No less a cutting-edge institution than the Florida Institute for Human and Machine Cognition has established a branch in Ocala’s tree-lined downtown, expecting to lure top researchers who value quality-of-life considerations along with the institute’s research capacity. The city is engaging in the very modern civic exercises of “visioning” and “economic gardening” — looking to capitalize on its virtues and generate a different kind of economic horsepower in the new era.
| A Community Portrait of Marion County |
Who Lives Here?
• Population
• Key Demographics
White, non-Hispanic: 76.2%
African-American: 11.9%
Hispanic: 9.6%
Compared to the average in Florida, Ocala/Marion’s residents:
» Are older (43.3 vs. 40)
» Are less well educated (16.5% with bachelor’s degree or higher vs. 25.7%)
» Spend less time commuting to work (24.3 minutes vs. 25.9)
» Are more likely to own the home where they live (76.8% vs. 70.3%)
» Are more likely to speak English at home (90% vs. 74%)
» Have a median household income of $41,128 vs. a state average of $48,637
Growth: Marion has been among Florida’s fastest-growing rural counties, with the population increasing nearly 40% from 1990-2000 and another 17% between 2000-06.
• Politics
Economic Life
 The Villages retirement development is a major economic driver in the region. [Photo: Demetrio Carrasco/Newscom] |
Economic Engines
» Traditionally, Ocala/Marion has relied on the housing industry to push economic growth, with the Villages development and retiree enclaves along State Road 200 becoming big economic drivers. The dependence on housing meant that the recession hit Marion County hard: Construction-related companies such as the Merillat cabinet-making factory shut down, and the county’s third-largest largest private employer, mortgage giant Taylor, Bean & Whitaker, filed for Chapter 11 bankruptcy protection. Marion’s unemployment rate hit 15% this spring, compared to the statewide rate of 12.3%. Housing in Marion will continue to be affordable, and the industry will remain a major economic engine, but economic developers are working hard to broaden the area’s base.
» Marion County’s moniker “Horse Capital of the World” is no exaggeration. Marion has more horses and ponies than any other county in the nation, USDA’s 2007 agricultural census confirms. The American Horse Council estimates more than three-fourths of the state’s thoroughbred breeding farms and training centers are concentrated in Marion, occupying some 70,000 acres. The 430 thoroughbred farms and more than 100 training centers generate more than 31,000 jobs and a $1.3-billion economic impact. The county also produces cattle, hogs, sheep and chickens and grows crops ranging from blueberries to peanuts, watermelons and corn.
 Marion has more horses than any other county in the country. |
» The trade, transportation and utilities sector is the largest in the county, employing almost a quarter of Marion County workers. Warehousing and distribution companies have continued to expand during the downturn. Regional beer wholesaler Cone Distributing is working on a $15-million expansion and plans to hire around 40.
» Marion’s education and health services sector is the second-largest, encompassing 15% of the county’s workforce.
» Manufacturing is also significant, with recent high-profile expansions that include Signature Brands and Santelli Glass. The county has seen big losses in both paper and chemical manufacturing positions but a 25% gain in higher-paying computer-manufacturing jobs.
» In technology, Marion has a cluster of providers serving the fire protection industry, ranging from E-One, a manufacturer of fire rescue vehicles, to Fire Programs Software. Intellon, a semiconductor manufacturer that was started in Ocala and employs around 60, became a division of California-based Atheros in 2009 but is expected to grow in a new downtown location. The Florida Institute for Human and Machine Cognition has opened a research lab branch in a renovated library downtown. Hydromentia, based in Ocala, is marketing patented water treatment technology.
» The Ocala/Marion County Chamber of Commerce, Ocala/Marion County Economic Development Corp. and the Small Business Development Center are working to establish an economic gardening program, and the city is working with urban planning consultant VHB MillerSellen on a three-year visioning process.
 The Florida Institute for Human and Machine Cognition has opened a branch in downtown Ocala. |
Big Employers
Marion County Public Schools, 6,080
Munroe Regional Medical Center, 2,500
 Munroe Regional Medical Center employs 2,500. |
State of Florida, 2,500
Walmart, 2,370
Publix Super Markets 1,400
Marion County, 1,539
Ocala Regional Medical Center & West Marion Community Hospital, 1,300
AT&T, 1,000
City of Ocala, 979
E-ONE, fire equipment manufacturing, 850
Federal government, 700
Lockheed Martin, 676
ClosetMaid, 600
Strengths & Weaknesses
Strengths
Natural amenities: Marion’s well-manicured horse farms, with their expansive pastures and centuries-old oaks, make for some of the most stunning natural beauty in Florida’s interior. The county is also home to several of the state’s last great wild places, including the Ocala National Forest and a key Florida watershed, the Ocklawaha River Watershed, fed by the city’s famous Silver River and Silver Springs. The Silver Springs zoological park is among the state’s most venerable tourist attractions.
 Ocala is known for its well-manicured horse farms. [Photo: Ocala-Marion County, FL VBC] |
Arts: The county is home to the Appleton Museum, the Ocala Civic Theater and the Fort King National Historic Landmark. The Ocala Symphony Orchestra has played a four-concert season — along with special free concerts —?since 1976.
Environmental ethic: Parts of the county have been ravaged by suburban-type sprawl, but in recent years local leaders have increasingly grasped the value of Marion’s natural treasures and worked hard to protect them. Marion is home to three first-magnitude springs, including Silver Springs, the largest inland spring in the state, gushing an average 516 million gallons of water a day. Spring flow remains relatively high compared to Florida’s other water supplies, and leaders are trying to keep it that way. County commissioners, for example, have passed several progressive springs protection measures in recent years, including a fertilizer ordinance and springs overlay zones in the comp plan.
Historic downtown: Ocala has a brick-lined downtown with a leafy public park and numerous buildings on the National Register of Historic Places. The Brick City Center for the Arts, coffee shops and several restaurants keep downtown’s blocks busy at night. Nearby residential neighborhoods feature well-maintained Victorian-style homes. Still, too few people live downtown to bring round-the-clock vibrance. City officials are working on an ambitious redevelopment effort that aims to spark residential development in the next few years.
Higher education and training: The public schools include the innovative Marion Technical Institute that trains high school students in specific careers, including industrial engineering and information technology. Ocala has three college campuses: College of Central Florida, Webster University and Rasmussen College. The University of Florida is a 40-minute drive north on U.S. 441.
Healthcare: The large retiree population draws considerable specialization, including cardiac and stroke care. Munroe Regional Medical Center is the longtime community hospital with 421 beds. Ocala Health System owns the 200-bed Ocala Regional Medical Center and 70-bed West Marion Community Hospital.
Weaknesses
Economic base: Housing, ultimately, doesn’t provide economic sustenance. The county needs a wider range of industries and businesses.
K-12 education: The school district gets a “B” grade from the state. The graduation rate is 75%, with fewer than two-thirds of students scoring at or above grade level in reading and two-thirds scoring at or above grade level in math. Marion County schools have a good reputation for kids who are college-bound, less so for others. None of the county’s public high schools received an “A” in the Florida Department of Education’s school rankings last year.
Quality of Life
 Neighborhoods feature Victorian-style homes. [Photo: Stephen Floethe] |
Outdoor lifestyle: The county’s signature springs, rivers and lakes make it a popular destination for kayaking and canoeing, as well as freshwater fishing. Largemouth bass are a common catch in Lake Weir and the Ocklawaha River. Equestrian, biking and hiking trails can be found along the Cross Florida Greenway and Florida Trail, including the popular Santos bike trail and landmark bridge over Interstate 75.
The arts: All those horses and all that water inspire local talent, nurtured by Gallery East Artists Cooperative, the Brick City Center for the Arts and other groups. The Appleton Museum of Art boasts impressive permanent collections from America, Africa, Asia, Europe and the Islamic world, as well as visiting exhibits like the current 19th century “American Masters.” The Ocala Civic Theatre, celebrating its 60th anniversary, stages a dozen professional plays a year and offers year-round classes for kids ages 4 through 18.
 Appleton Museum of Art [Photo: Ocala-Marion County, FL VBC] |
The Ocala Symphony Orchestra averages a dozen concerts throughout the year in front of nearly ten thousand area citizens. Its mission is to play the highest caliber music under the dynamic leadership of 27-year-old music director Matthew Wardell. The symphony has performed Messiah, Beethoven's Ninth, Symphony Under the Stars (Mothers Day,) Symphony Under the Lights (December.) They also perform a series in conjunction with the Appleton Museum of Art, host a Young Artist Competition, and have a youth outreach to local schools. More info: www.ocalasymphony.com.
Fly-in: George Steinbrenner and John Travolta are among the jet-set with homes in Marion County’s pastoral hills. Steinbrenner has a horse farm, Kinsman Stud Farm, on 850 acres. Travolta and his family live in “Jumbolair,” a 550-acre development where each home has its own taxiway.
Affordability: Marion County residents pay median real estate taxes of $1,200 on a $159,600 home. They pay 20% less than the statewide average on housing and about 10% less overall. The county ranks 43 among Florida’s 67 counties in total taxes levied per capita.
Crime: According to figures from the Florida Department of Law Enforcement, Marion County — 16th in population —?ranks 48 among the state’s counties in crimes per 100,000 population.
Health: Children in the district comprising Marion and Alachua counties are among the most likely in the state to have health insurance, according to a 2008 report, Child Health and Healthcare Quality in Florida. Only 6.2% of children under 19 in the two counties are uninsured.
Must-Know Contacts
» Ted Adams, executive vice president, Moss Construction
» Jaye Baillie, president/CEO, Ocala/Marion County Chamber of Commerce
» Martha Barnwell, vice president, North Coastal Region, Progress Energy Florida
» Mary Britt, executive director, Ocala Civic Theatre
» Doug Cone Jr., president/CEO, Cone Distributing
 Cretul |
» Larry Cretul, Ocala Realtor and outgoing House Speaker
» Ken Daley, president/ COO, Bernie Little Distributing, and 2009-10 chair of the Young Presidents’ Organization’s Florida chapter.
 Dassance  Fakhoury |
» Rex Etheredge, president/CEO, Ocala Regional Medical Center
» Dr. Manal Fakhoury, pharmacist, Ocala Regional Medical Center
» Richard “Dick” Hancock, executive vice president, Florida Thoroughbred Breeders’ and Owners’ Association
» First Avenue National Bank President and CEO John Hunt, this year’s chamber president
» Nancy Ledding, executive director, Marion Cultural Alliance
» Brian O’Connor, head of Ocala operations for Lockheed Martin
» Mary Ellen Poe, Hospice of Marion County
» Mike O’Farrell, owner, Ocala Stud, one of the county’s original horse farms
» Steve Purves, president/CEO, Munroe Regional Medical Center
 Ledding |
» Carole Savage, executive director, Public Education Foundation of Marion County
» Jim Schneider, CEO/president, food manufacturer Signature Brands
» Karen Reed, director, AT&T Mobility in Ocala and civic leader
» Ann Sternal, executive director, Marion County Convention & Visitors Bureau
» Pete Tesch, president/CEO, Ocala/Marion County Economic Development Corp.
Why I Live Here
 |
Carol and I have been welcomed by the community. We are finding it easy to become involved with great causes and truly committed people who are eager to make a difference. I would recommend Ocala to anyone who has a true love for horses.
Frank Hennessey
?
?
 Fechtman |
Last year, two partners and I started a business advisory firm called Root Theory. None of us are natives of Ocala, and we could have started the firm anywhere in the Southeast. We decided very quickly that we all wanted to remain in this wonderful city. Our decision has paid off. We have successfully grown our business, with clients throughout Florida. We plan to expand in North Carolina in the next 12 months and then hope to expand nationally and in the Caribbean. When we do, we will keep Ocala our home.
Dave Fechtman